Witam, od jakiegoś czasu wyskakują mi blue screeny, oraz błędy różnych programów, gier, po czym się wyłączają. Zrobiłem analizę pliku dmp, i teraz proszę o pomoc w odczytaniu - znalezienie jednoznacznej przyczyny (wydaję mi się, że to wina RAMu).
Microsoft (R) Windows Debugger Version 6.11.0001.404 X86
Copyright (c) Microsoft Corporation. All rights reserved.


Loading Dump File [C:\WINDOWS\Minidump\Mini081913-01.dmp]
Mini Kernel Dump File: Only registers and stack trace are available

Symbol search path is: SRV*c:\symbols*http://msdl.microsoft.com/download/symbols
Executable search path is:
Windows XP Kernel Version 2600 (Service Pack 3) MP (2 procs) Free x86 compatible
Product: WinNt, suite: TerminalServer SingleUserTS
Built by: 2600.xpsp_sp3_qfe.090206-1316
Machine Name:
Kernel base = 0x804d7000 PsLoadedModuleList = 0x8055d720
Debug session time: Mon Aug 19 21:24:46.500 2013 (GMT+2)
System Uptime: 0 days 0:00:56.189
Loading Kernel Symbols
...............................................................
...............................................................
Loading User Symbols
Loading unloaded module list
...........
*******************************************************************************
*                                                                             *
*                        Bugcheck Analysis                                    *
*                                                                             *
*******************************************************************************

Use !analyze -v to get detailed debugging information.

BugCheck 1000000A, {9cde0240, 2, 0, 80523b3a}

Probably caused by : memory_corruption ( nt!MiDeletePte+198 )

Followup: MachineOwner
---------

0: kd> !analyze -v
*******************************************************************************
*                                                                             *
*                        Bugcheck Analysis                                    *
*                                                                             *
*******************************************************************************

IRQL_NOT_LESS_OR_EQUAL (a)
An attempt was made to access a pageable (or completely invalid) address at an
interrupt request level (IRQL) that is too high.  This is usually
caused by drivers using improper addresses.
If a kernel debugger is available get the stack backtrace.
Arguments:
Arg1: 9cde0240, memory referenced
Arg2: 00000002, IRQL
Arg3: 00000000, bitfield :
	bit 0 : value 0 = read operation, 1 = write operation
	bit 3 : value 0 = not an execute operation, 1 = execute operation (only on chips which support this level of status)
Arg4: 80523b3a, address which referenced memory

Debugging Details:
------------------


READ_ADDRESS:  9cde0240

CURRENT_IRQL:  2

FAULTING_IP:
nt!MiDeletePte+198
80523b3a 8b420c          mov     eax,dword ptr [edx+0Ch]

CUSTOMER_CRASH_COUNT:  1

DEFAULT_BUCKET_ID:  DRIVER_FAULT

BUGCHECK_STR:  0xA

PROCESS_NAME:  AVENGINE.EXE

LAST_CONTROL_TRANSFER:  from 80523fb8 to 80523b3a

STACK_TEXT:
b0a0cbc8 80523fb8 c00c1648 182c9000 00000000 nt!MiDeletePte+0x198
b0a0cc90 8051a628 00013b48 1aad4fff 00000000 nt!MiDeleteVirtualAddresses+0x164
b0a0ccac 805b33d8 15b60000 1aad4fff b0a0cd64 nt!MiDeleteFreeVm+0x20
b0a0cd4c 8054162c ffffffff 12dae2b4 12dae2cc nt!NtFreeVirtualMemory+0x42e
b0a0cd4c 7c90e514 ffffffff 12dae2b4 12dae2cc nt!KiFastCallEntry+0xfc
WARNING: Frame IP not in any known module. Following frames may be wrong.
12dae214 00000000 00000000 00000000 00000000 0x7c90e514


STACK_COMMAND:  kb

FOLLOWUP_IP:
nt!MiDeletePte+198
80523b3a 8b420c          mov     eax,dword ptr [edx+0Ch]

SYMBOL_STACK_INDEX:  0

SYMBOL_NAME:  nt!MiDeletePte+198

FOLLOWUP_NAME:  MachineOwner

MODULE_NAME: nt

DEBUG_FLR_IMAGE_TIMESTAMP:  498c114b

IMAGE_NAME:  memory_corruption

FAILURE_BUCKET_ID:  0xA_nt!MiDeletePte+198

BUCKET_ID:  0xA_nt!MiDeletePte+198

Followup: MachineOwner
---------
Z tego co widać to doszło do błędu w procesie AVENGINE.exe, no ale chyba zostało to spowodowane przez RAM. Proszę o pomoc.
Pełna konfiguracja komputera z uwzględnieniem marki i modelu zasilacza?!
Wykonaj test pamięci:
Pobierz stąd: http://www.memtest.org/#downiso Rozpakuj, nagraj obraz na płytę i uruchom z niej komputer. Możesz także ściągnąć wersję na pendrive. (dwa przejścia programu).
Zamieść w załączniku (po spakowaniu) zawartość katalogu Windows/minidump
Możesz mi to trochę jaśniej napisać? Chcę tą wersję na pendriva (która to jest) i co mam z nią zrobić (zainstalować na tym pedrivie, wkleić)?
Później te pliki z minidump dać do załącznika?
Właśnie jestem w trakcie testowania jednej kości pamięci. Na ekranie widnieje napis
Pass: xxx%
Test: xxx%
Mam już jeden pass wykonany. Ile jeszcze ich będzie?
Załączam nowy plik .dmp i screen z dzisiejszym blue screenem. Nowy plik .dmp w pierwszym poście.
Dodano po 2 [godziny] 54 [minuty]:
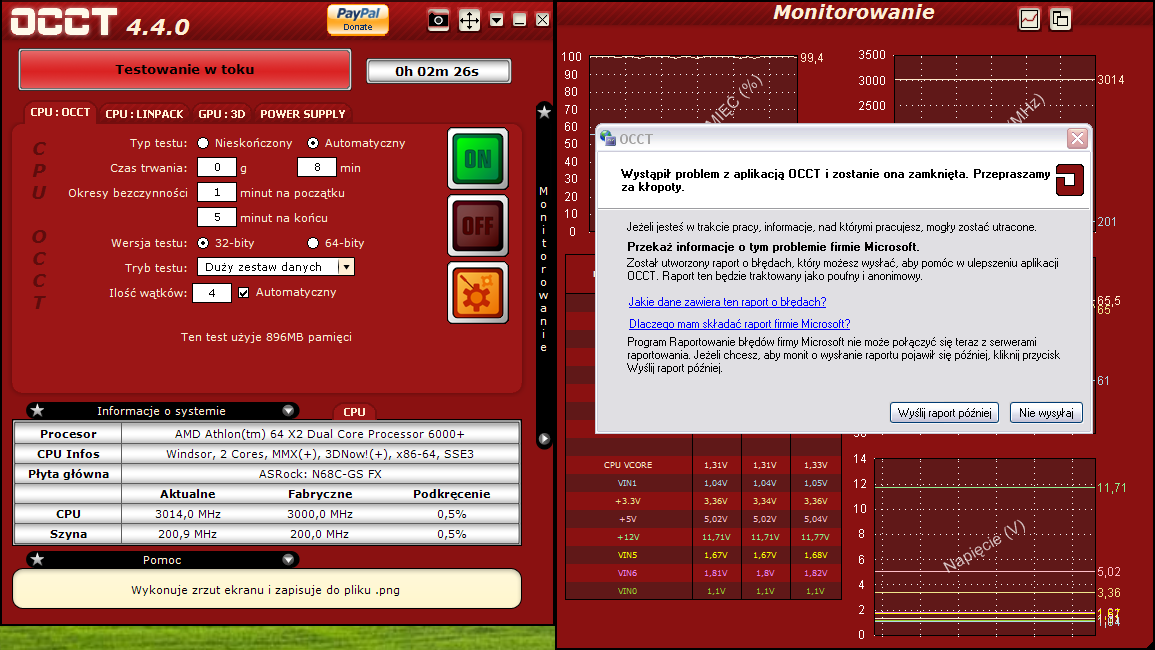
Proszę pomóżcie Nie mogę nic robić. Gram w Obliviona po jakimś czasie gra sie zamyka i wyskakuję raport o błedzie. Gram w League of Legends po kilkunastu minutach gra sie wylacza i report o bledzie. Oglądam filmiki na YT w google chrome, przegladarka sie zawiesza. Odpalam tryb ekonomiczny w tuneup - report o bledzie.
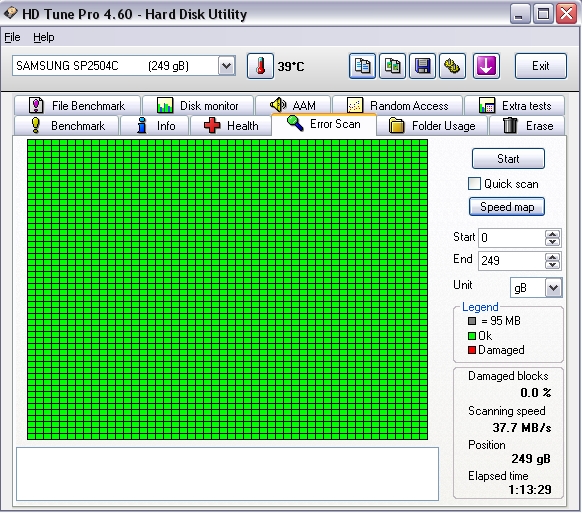
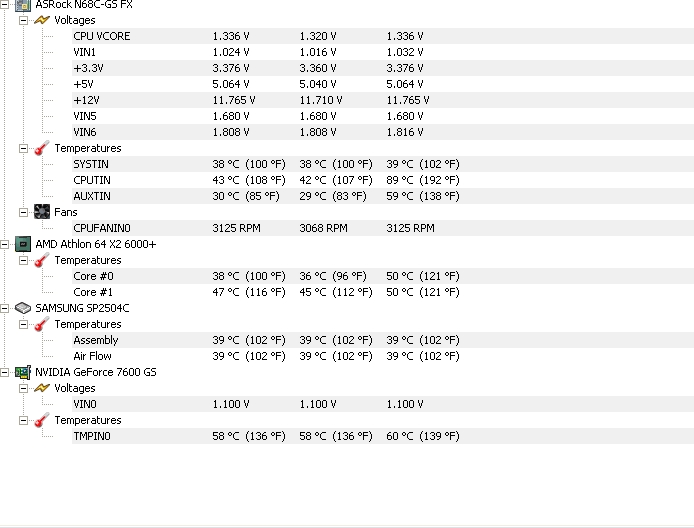
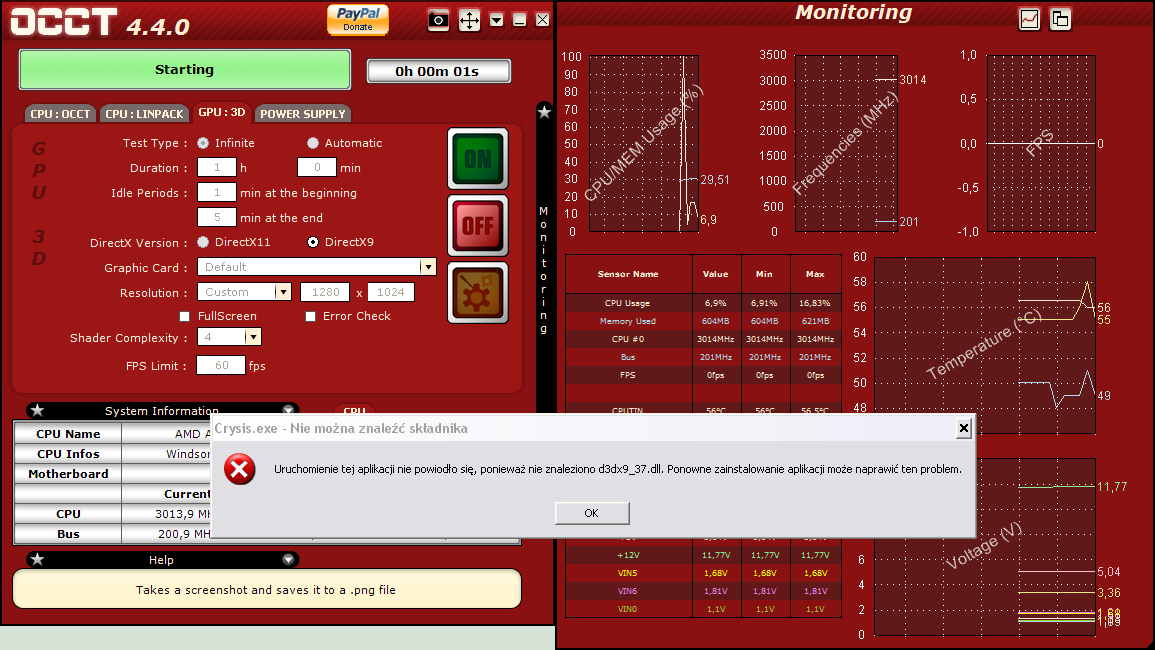
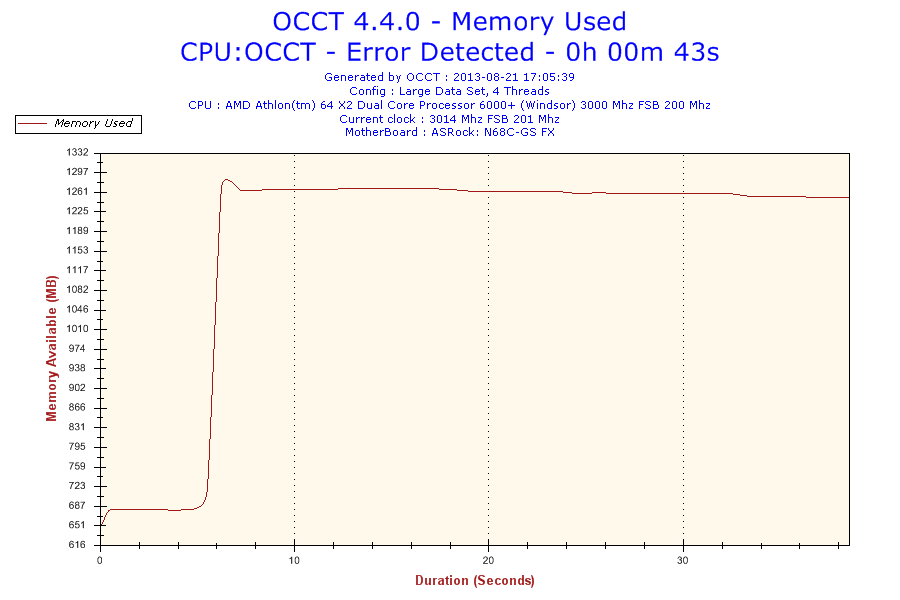
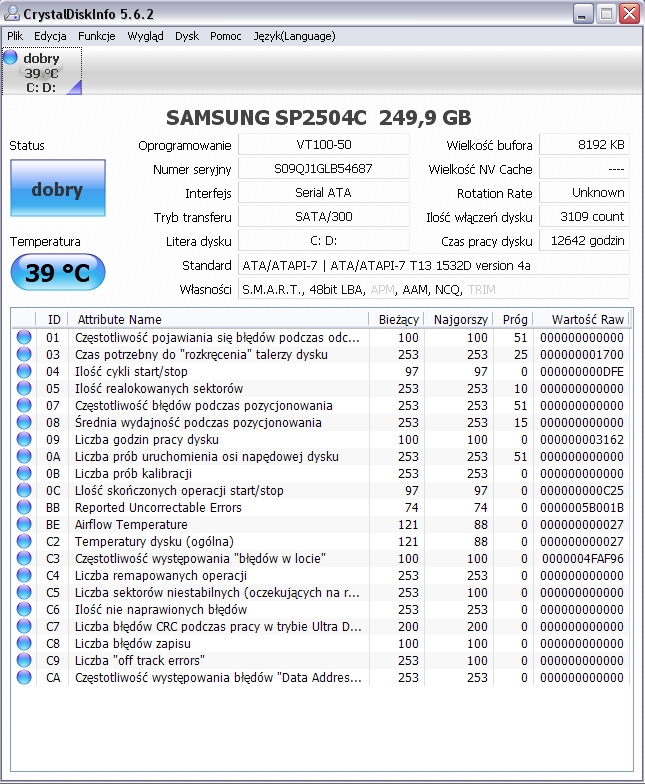
Dodałem jeszcze 2 screeny z różnych programów. Może coś pomogą.
Zrobiłem format. Pandy już nie instalowałem, korzystam teraz z antywirusa Microsoftu. Screeny z testu niedługo wrzucę.
Nie daję załącznika, bo można tylko 10 plików a tego jest trochę sporo, więc wrzuciłem na serwer. Nie wiem co jest potrzebne a co nie.
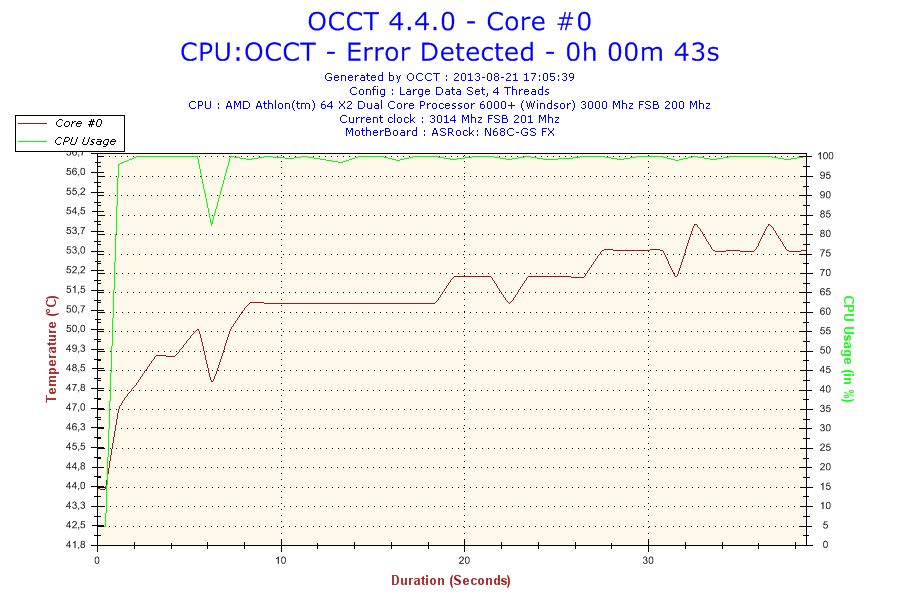
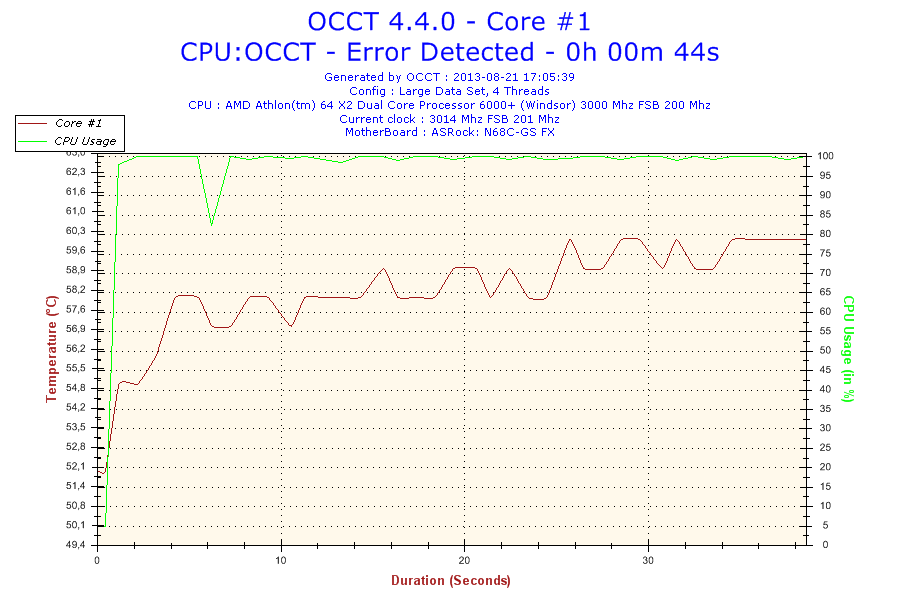
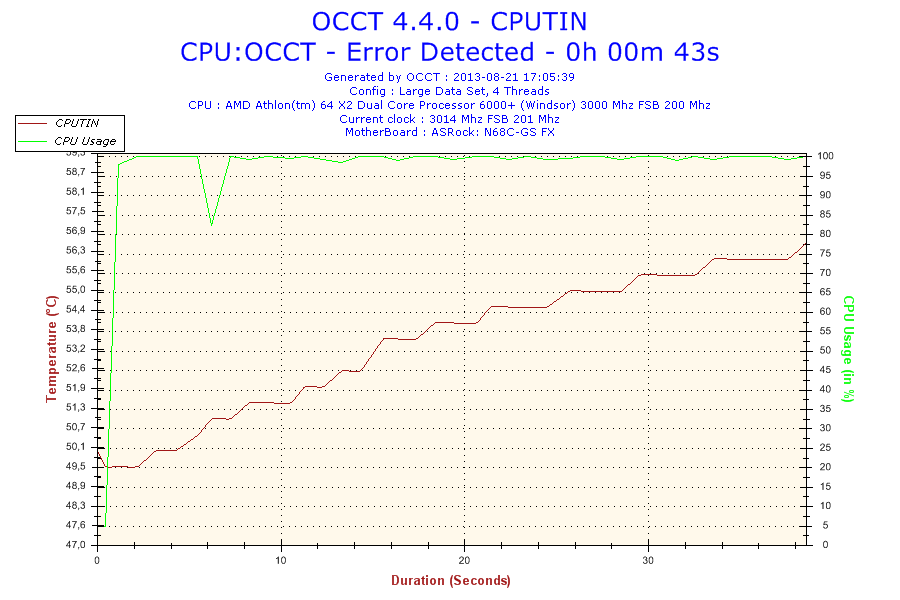
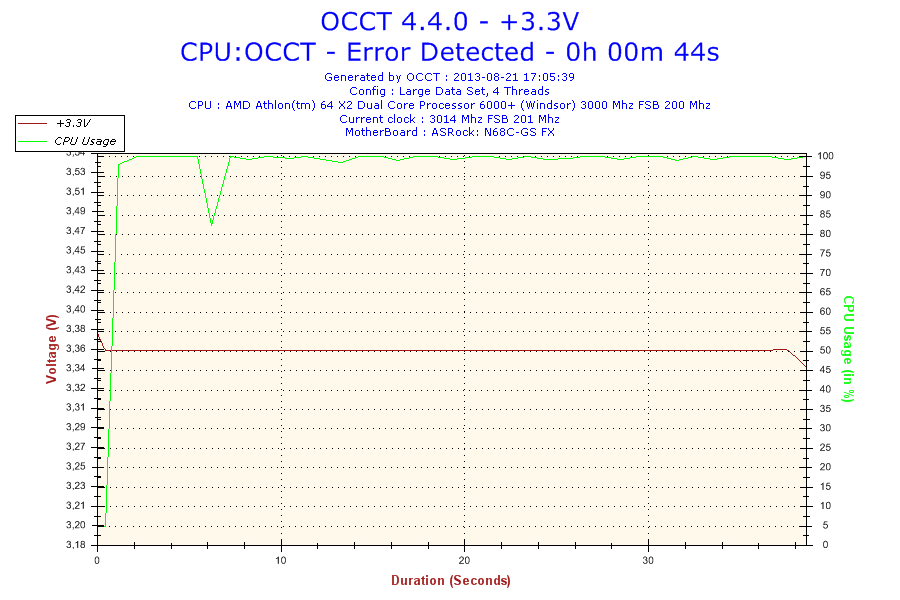
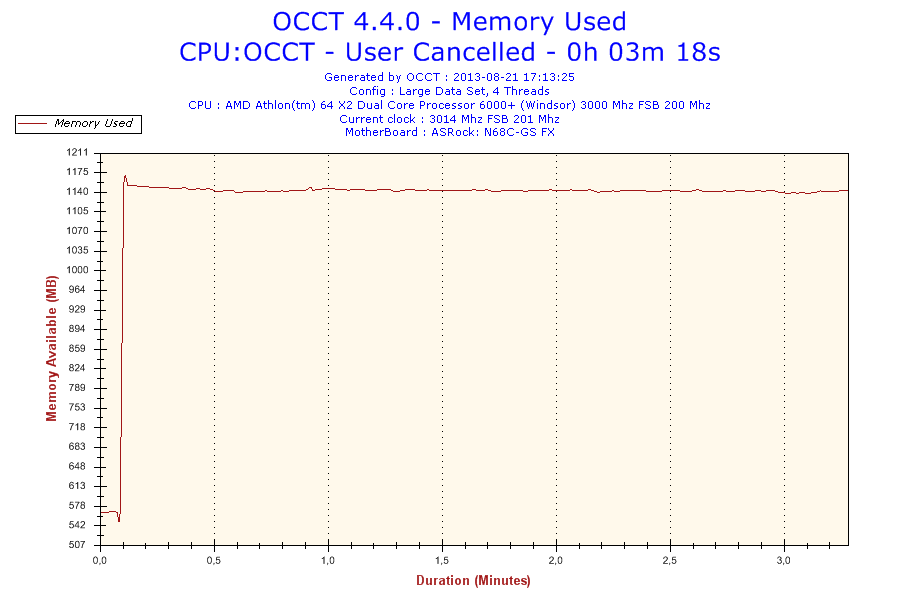
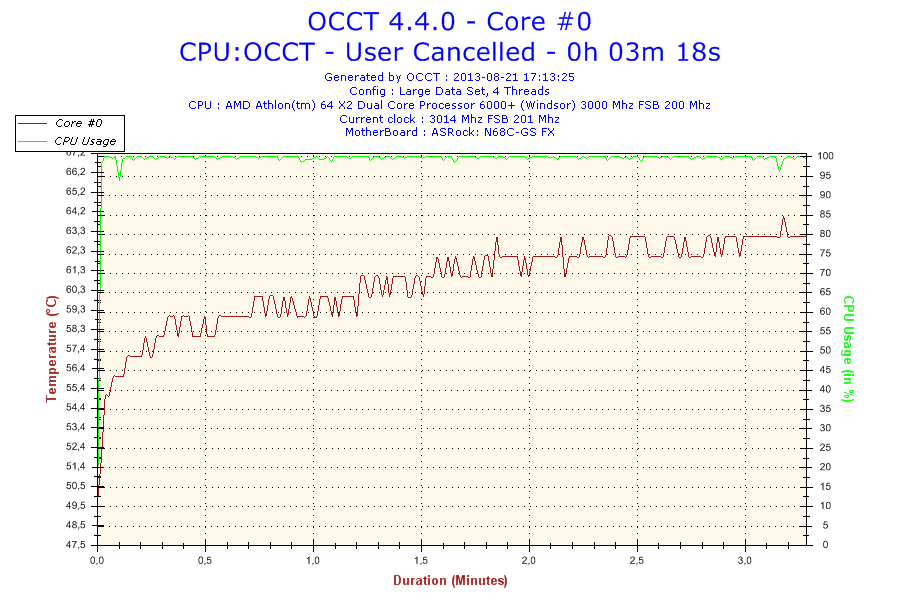
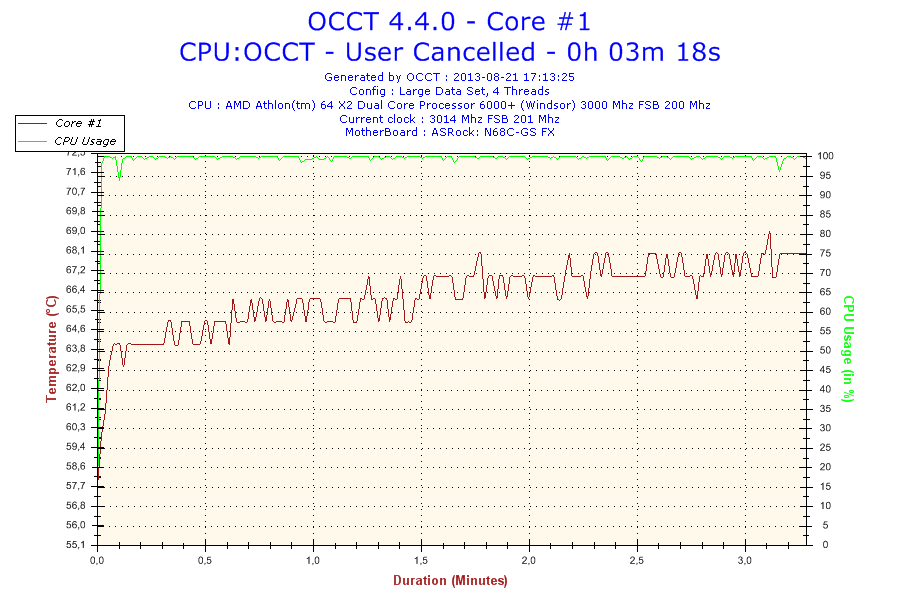
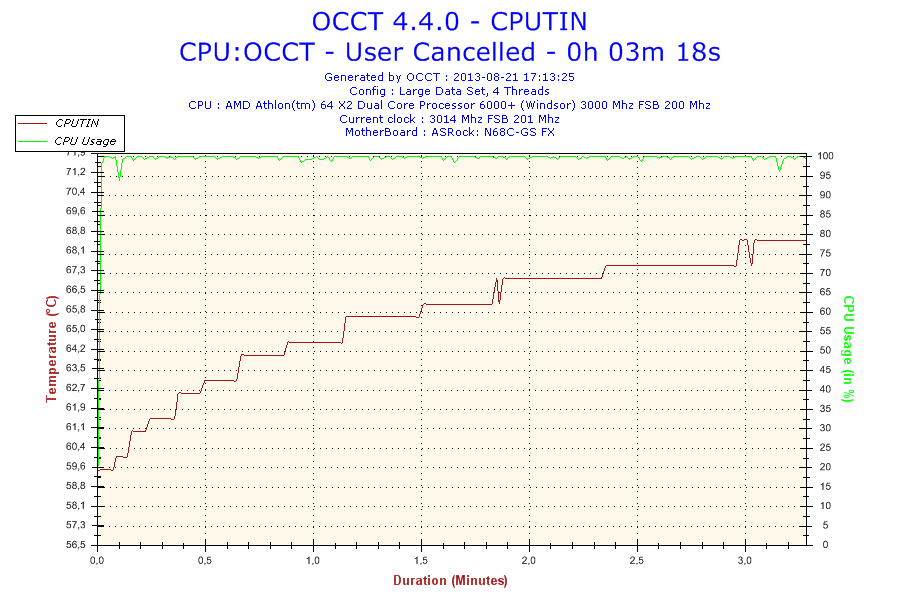
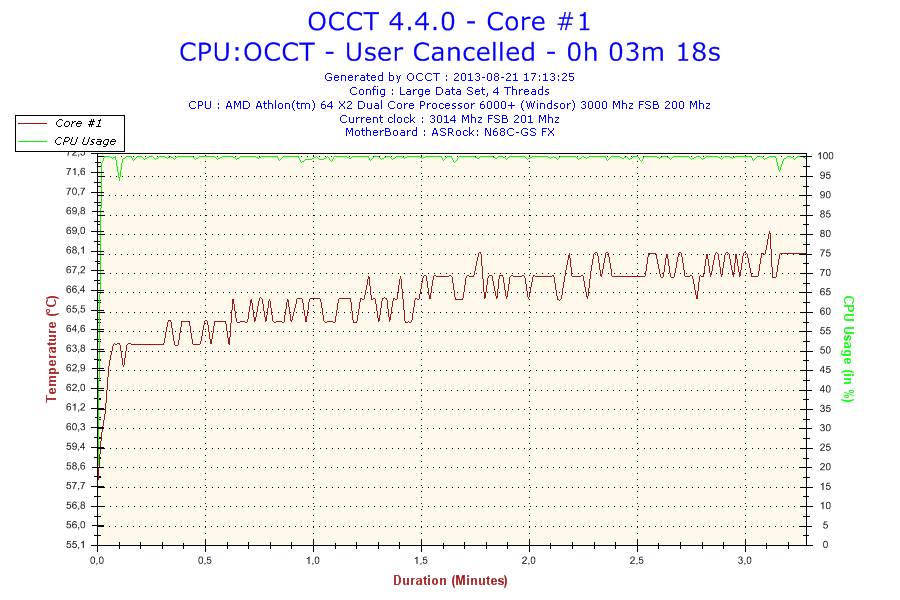
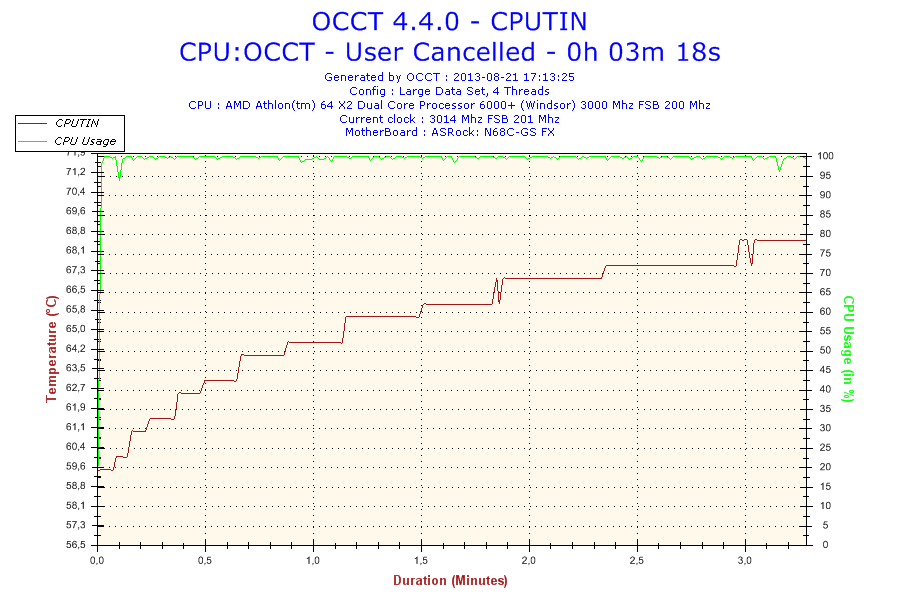
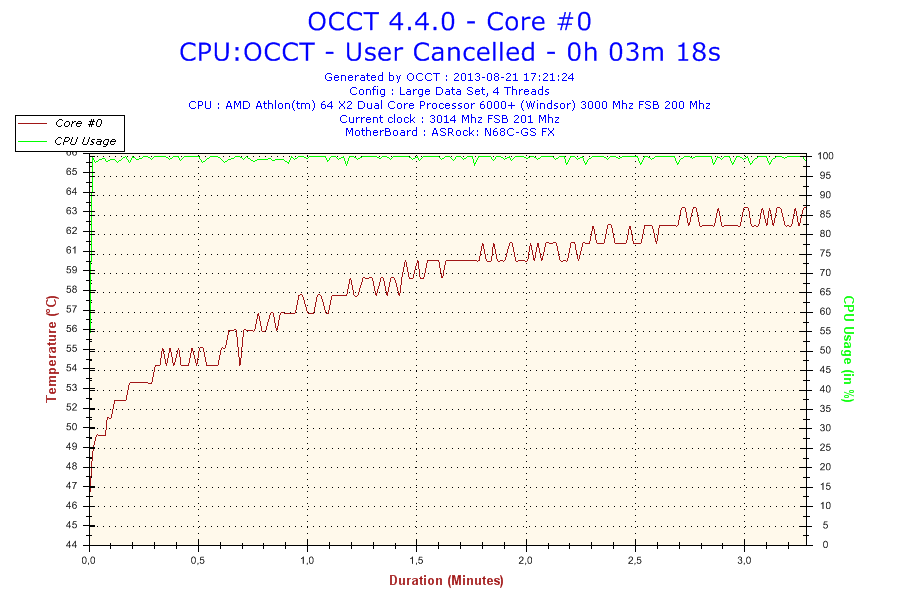
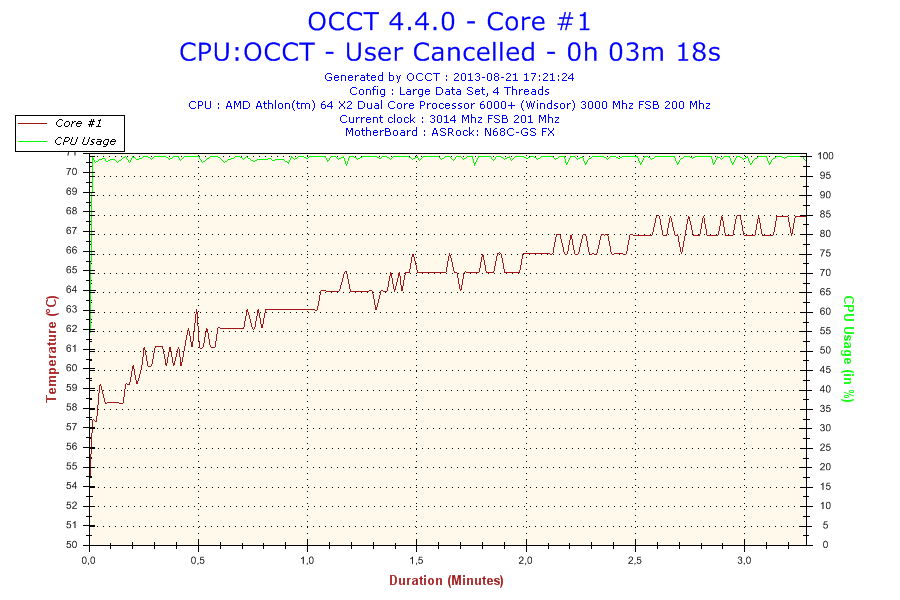
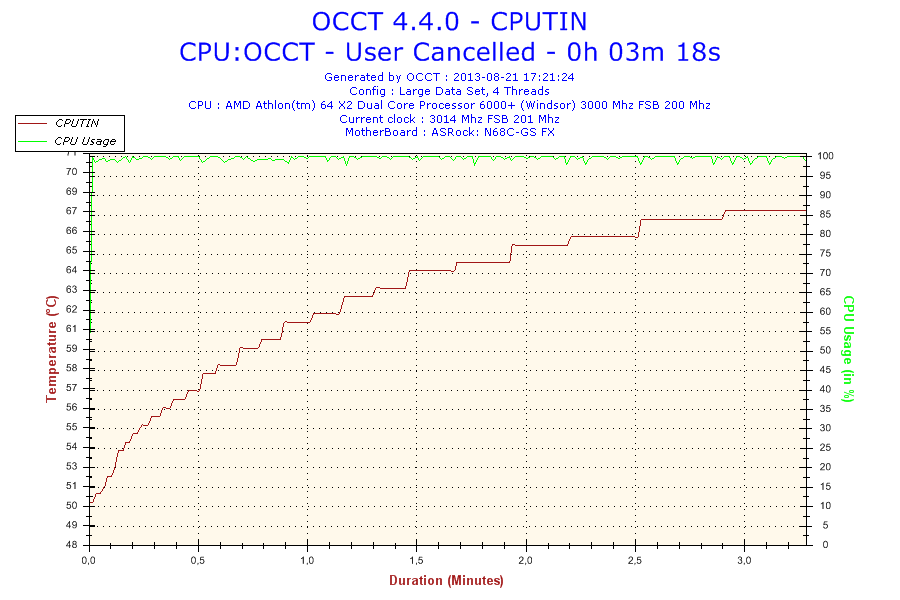
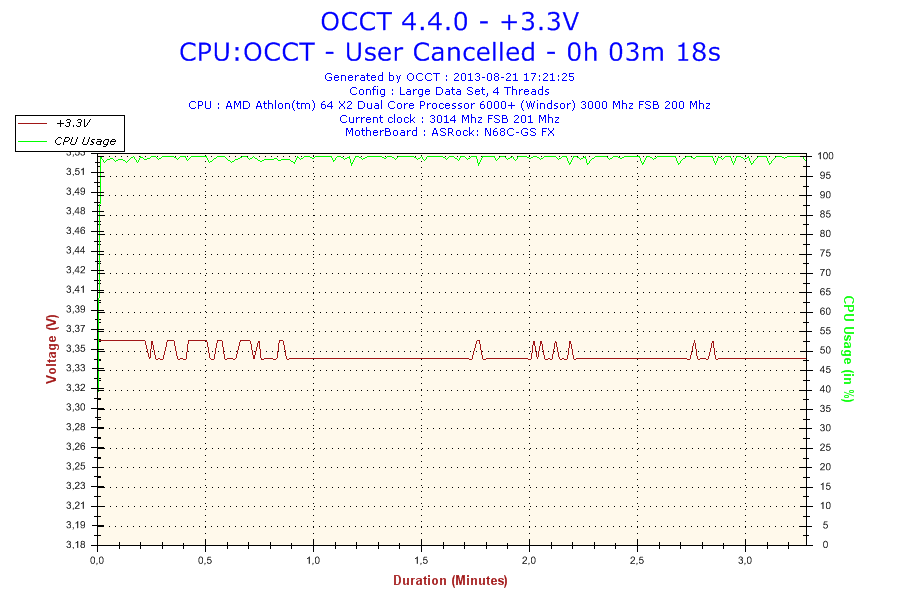
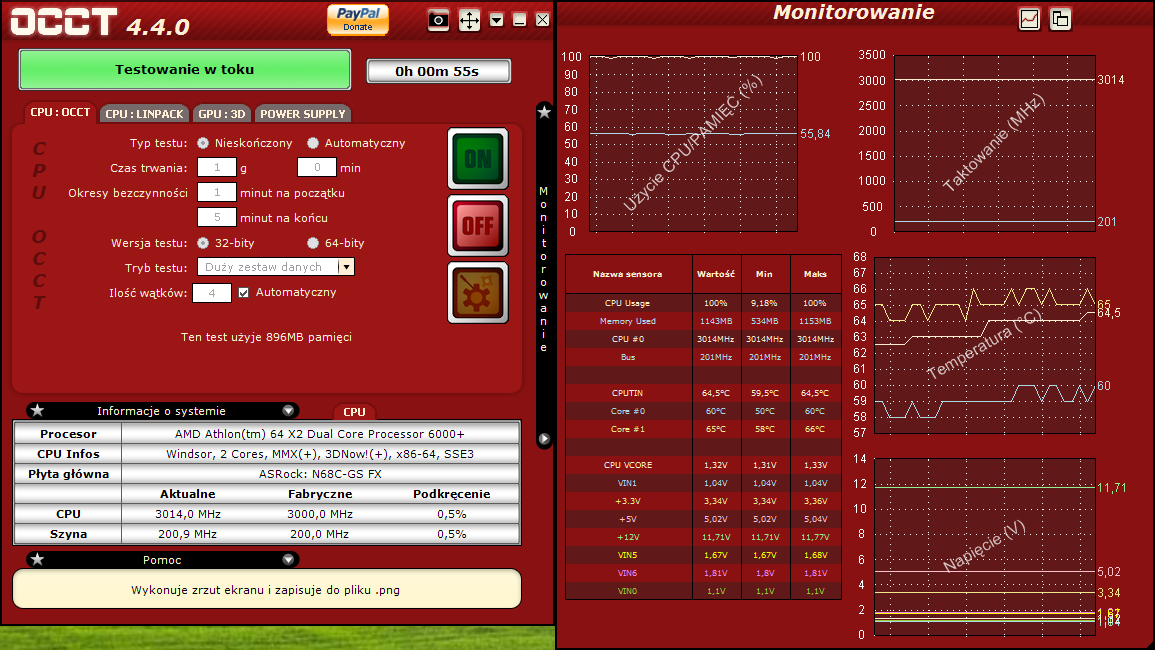
przede wszystkim sprawdź temperature procesora occt, zmień mu paste popraw chłodzenie i daj znać co dalej sie dzieje, odśwież także chłodzenie od karty graficznej, żadko jest to problemem ale spróbuj.
Zamówię dzisiaj nową pastę termoprzewodząca i zobaczymy co to będzie. Ale jakoś nie chcę mi się wierzyć, że taka jest właśnie przyczyna, ale sprawdzić zawsze warto W chwili obecnej nie mogę dokończyć patchowania gry League of Legends, bo wyskakują błedy. Wrzucę niedługo logi z dwóch plików dmp.
Spoiler:
Microsoft (R) Windows Debugger Version 6.11.0001.404 X86
Copyright (c) Microsoft Corporation. All rights reserved.
Loading Dump File [C:\Documents and Settings\Mati\Pulpit\Mini082113-01.dmp]
Mini Kernel Dump File: Only registers and stack trace are available
Symbol search path is: *** Invalid ***
****************************************************************************
* Symbol loading may be unreliable without a symbol search path. *
* Use .symfix to have the debugger choose a symbol path. *
* After setting your symbol path, use .reload to refresh symbol locations. *
****************************************************************************
Executable search path is:
*********************************************************************
* Symbols can not be loaded because symbol path is not initialized. *
* *
* The Symbol Path can be set by: *
* using the _NT_SYMBOL_PATH environment variable. *
* using the -y <symbol_path> argument when starting the debugger. *
* using .sympath and .sympath+ *
*********************************************************************
Unable to load image ntoskrnl.exe, Win32 error 0n2
*** WARNING: Unable to verify timestamp for ntoskrnl.exe
*** ERROR: Module load completed but symbols could not be loaded for ntoskrnl.exe
Windows XP Kernel Version 2600 (Service Pack 3) MP (2 procs) Free x86 compatible
Product: WinNt, suite: TerminalServer SingleUserTS
Machine Name:
Kernel base = 0x804d7000 PsLoadedModuleList = 0x8055d720
Debug session time: Wed Aug 21 18:23:37.718 2013 (GMT+2)
System Uptime: 0 days 1:21:00.419
*********************************************************************
* Symbols can not be loaded because symbol path is not initialized. *
* *
* The Symbol Path can be set by: *
* using the _NT_SYMBOL_PATH environment variable. *
* using the -y <symbol_path> argument when starting the debugger. *
* using .sympath and .sympath+ *
*********************************************************************
Unable to load image ntoskrnl.exe, Win32 error 0n2
*** WARNING: Unable to verify timestamp for ntoskrnl.exe
*** ERROR: Module load completed but symbols could not be loaded for ntoskrnl.exe
Loading Kernel Symbols
...............................................................
..................................................
Loading User Symbols
Loading unloaded module list
.................
*******************************************************************************
* *
* Bugcheck Analysis *
* *
*******************************************************************************
Use !analyze -v to get detailed debugging information.
BugCheck 4E, {2, 30008, 7ff9f, 1}
***** Kernel symbols are WRONG. Please fix symbols to do analysis.
*** WARNING: Unable to verify timestamp for Ntfs.sys
*** ERROR: Module load completed but symbols could not be loaded for Ntfs.sys
*** WARNING: Unable to verify timestamp for fltMgr.sys
*** ERROR: Module load completed but symbols could not be loaded for fltMgr.sys
*************************************************************************
*** ***
*** ***
*** Your debugger is not using the correct symbols ***
*** ***
*** In order for this command to work properly, your symbol path ***
*** must point to .pdb files that have full type information. ***
*** ***
*** Certain .pdb files (such as the public OS symbols) do not ***
*** contain the required information. Contact the group that ***
*** provided you with these symbols if you need this command to ***
*** work. ***
*** ***
*** Type referenced: nt!_KPRCB ***
*** ***
*************************************************************************
*************************************************************************
*** ***
*** ***
*** Your debugger is not using the correct symbols ***
*** ***
*** In order for this command to work properly, your symbol path ***
*** must point to .pdb files that have full type information. ***
*** ***
*** Certain .pdb files (such as the public OS symbols) do not ***
*** contain the required information. Contact the group that ***
*** provided you with these symbols if you need this command to ***
*** work. ***
*** ***
*** Type referenced: nt!_KPRCB ***
*** ***
*************************************************************************
*********************************************************************
* Symbols can not be loaded because symbol path is not initialized. *
* *
* The Symbol Path can be set by: *
* using the _NT_SYMBOL_PATH environment variable. *
* using the -y <symbol_path> argument when starting the debugger. *
* using .sympath and .sympath+ *
*********************************************************************
*********************************************************************
* Symbols can not be loaded because symbol path is not initialized. *
* *
* The Symbol Path can be set by: *
* using the _NT_SYMBOL_PATH environment variable. *
* using the -y <symbol_path> argument when starting the debugger. *
* using .sympath and .sympath+ *
*********************************************************************
Probably caused by : ntoskrnl.exe ( nt+22fa3 )
PFN_LIST_CORRUPT (4e)
Typically caused by drivers passing bad memory descriptor lists (ie: calling
MmUnlockPages twice with the same list, etc). If a kernel debugger is
available get the stack trace.
Arguments:
Arg1: 00000002, A list entry was corrupt
Arg2: 00030008, entry in list being removed
Arg3: 0007ff9f, highest physical page number
Arg4: 00000001, reference count of entry being removed
Debugging Details:
------------------
***** Kernel symbols are WRONG. Please fix symbols to do analysis.
*************************************************************************
*** ***
*** ***
*** Your debugger is not using the correct symbols ***
*** ***
*** In order for this command to work properly, your symbol path ***
*** must point to .pdb files that have full type information. ***
*** ***
*** Certain .pdb files (such as the public OS symbols) do not ***
*** contain the required information. Contact the group that ***
*** provided you with these symbols if you need this command to ***
*** work. ***
*** ***
*** Type referenced: nt!_KPRCB ***
*** ***
*************************************************************************
*************************************************************************
*** ***
*** ***
*** Your debugger is not using the correct symbols ***
*** ***
*** In order for this command to work properly, your symbol path ***
*** must point to .pdb files that have full type information. ***
*** ***
*** Certain .pdb files (such as the public OS symbols) do not ***
*** contain the required information. Contact the group that ***
*** provided you with these symbols if you need this command to ***
*** work. ***
*** ***
*** Type referenced: nt!_KPRCB ***
*** ***
*************************************************************************
*********************************************************************
* Symbols can not be loaded because symbol path is not initialized. *
* *
* The Symbol Path can be set by: *
* using the _NT_SYMBOL_PATH environment variable. *
* using the -y <symbol_path> argument when starting the debugger. *
* using .sympath and .sympath+ *
*********************************************************************
*********************************************************************
* Symbols can not be loaded because symbol path is not initialized. *
* *
* The Symbol Path can be set by: *
* using the _NT_SYMBOL_PATH environment variable. *
* using the -y <symbol_path> argument when starting the debugger. *
* using .sympath and .sympath+ *
*********************************************************************
ADDITIONAL_DEBUG_TEXT:
Use '!findthebuild' command to search for the target build information.
If the build information is available, run '!findthebuild -s ; .reload' to set symbol path and load symbols.
Microsoft (R) Windows Debugger Version 6.11.0001.404 X86
Copyright (c) Microsoft Corporation. All rights reserved.
Loading Dump File [C:\Documents and Settings\Mati\Pulpit\Mini082113-02.dmp]
Mini Kernel Dump File: Only registers and stack trace are available
Symbol search path is: *** Invalid ***
****************************************************************************
* Symbol loading may be unreliable without a symbol search path. *
* Use .symfix to have the debugger choose a symbol path. *
* After setting your symbol path, use .reload to refresh symbol locations. *
****************************************************************************
Executable search path is:
*********************************************************************
* Symbols can not be loaded because symbol path is not initialized. *
* *
* The Symbol Path can be set by: *
* using the _NT_SYMBOL_PATH environment variable. *
* using the -y <symbol_path> argument when starting the debugger. *
* using .sympath and .sympath+ *
*********************************************************************
Unable to load image ntoskrnl.exe, Win32 error 0n2
*** WARNING: Unable to verify timestamp for ntoskrnl.exe
*** ERROR: Module load completed but symbols could not be loaded for ntoskrnl.exe
Windows XP Kernel Version 2600 (Service Pack 3) MP (2 procs) Free x86 compatible
Product: WinNt, suite: TerminalServer SingleUserTS
Machine Name:
Kernel base = 0x804d7000 PsLoadedModuleList = 0x8055d720
Debug session time: Wed Aug 21 22:01:55.421 2013 (GMT+2)
System Uptime: 0 days 3:37:58.120
*********************************************************************
* Symbols can not be loaded because symbol path is not initialized. *
* *
* The Symbol Path can be set by: *
* using the _NT_SYMBOL_PATH environment variable. *
* using the -y <symbol_path> argument when starting the debugger. *
* using .sympath and .sympath+ *
*********************************************************************
Unable to load image ntoskrnl.exe, Win32 error 0n2
*** WARNING: Unable to verify timestamp for ntoskrnl.exe
*** ERROR: Module load completed but symbols could not be loaded for ntoskrnl.exe
Loading Kernel Symbols
...............................................................
..................................................
Loading User Symbols
Loading unloaded module list
...........
Unable to load image win32k.sys, Win32 error 0n2
*** WARNING: Unable to verify timestamp for win32k.sys
*** ERROR: Module load completed but symbols could not be loaded for win32k.sys
*******************************************************************************
* *
* Bugcheck Analysis *
* *
*******************************************************************************
Use !analyze -v to get detailed debugging information.
***** Kernel symbols are WRONG. Please fix symbols to do analysis.
*************************************************************************
*** ***
*** ***
*** Your debugger is not using the correct symbols ***
*** ***
*** In order for this command to work properly, your symbol path ***
*** must point to .pdb files that have full type information. ***
*** ***
*** Certain .pdb files (such as the public OS symbols) do not ***
*** contain the required information. Contact the group that ***
*** provided you with these symbols if you need this command to ***
*** work. ***
*** ***
*** Type referenced: nt!_KPRCB ***
*** ***
*************************************************************************
*************************************************************************
*** ***
*** ***
*** Your debugger is not using the correct symbols ***
*** ***
*** In order for this command to work properly, your symbol path ***
*** must point to .pdb files that have full type information. ***
*** ***
*** Certain .pdb files (such as the public OS symbols) do not ***
*** contain the required information. Contact the group that ***
*** provided you with these symbols if you need this command to ***
*** work. ***
*** ***
*** Type referenced: nt!_KPRCB ***
*** ***
*************************************************************************
*********************************************************************
* Symbols can not be loaded because symbol path is not initialized. *
* *
* The Symbol Path can be set by: *
* using the _NT_SYMBOL_PATH environment variable. *
* using the -y <symbol_path> argument when starting the debugger. *
* using .sympath and .sympath+ *
*********************************************************************
*********************************************************************
* Symbols can not be loaded because symbol path is not initialized. *
* *
* The Symbol Path can be set by: *
* using the _NT_SYMBOL_PATH environment variable. *
* using the -y <symbol_path> argument when starting the debugger. *
* using .sympath and .sympath+ *
*********************************************************************
Probably caused by : win32k.sys ( win32k+62276 )
KERNEL_MODE_EXCEPTION_NOT_HANDLED_M (1000008e)
This is a very common bugcheck. Usually the exception address pinpoints
the driver/function that caused the problem. Always note this address
as well as the link date of the driver/image that contains this address.
Some common problems are exception code 0x80000003. This means a hard
coded breakpoint or assertion was hit, but this system was booted
/NODEBUG. This is not supposed to happen as developers should never have
hardcoded breakpoints in retail code, but ...
If this happens, make sure a debugger gets connected, and the
system is booted /DEBUG. This will let us see why this breakpoint is
happening.
Arguments:
Arg1: c0000005, The exception code that was not handled
Arg2: bf862276, The address that the exception occurred at
Arg3: a86f8ae4, Trap Frame
Arg4: 00000000
Debugging Details:
------------------
***** Kernel symbols are WRONG. Please fix symbols to do analysis.
*************************************************************************
*** ***
*** ***
*** Your debugger is not using the correct symbols ***
*** ***
*** In order for this command to work properly, your symbol path ***
*** must point to .pdb files that have full type information. ***
*** ***
*** Certain .pdb files (such as the public OS symbols) do not ***
*** contain the required information. Contact the group that ***
*** provided you with these symbols if you need this command to ***
*** work. ***
*** ***
*** Type referenced: nt!_KPRCB ***
*** ***
*************************************************************************
*************************************************************************
*** ***
*** ***
*** Your debugger is not using the correct symbols ***
*** ***
*** In order for this command to work properly, your symbol path ***
*** must point to .pdb files that have full type information. ***
*** ***
*** Certain .pdb files (such as the public OS symbols) do not ***
*** contain the required information. Contact the group that ***
*** provided you with these symbols if you need this command to ***
*** work. ***
*** ***
*** Type referenced: nt!_KPRCB ***
*** ***
*************************************************************************
*********************************************************************
* Symbols can not be loaded because symbol path is not initialized. *
* *
* The Symbol Path can be set by: *
* using the _NT_SYMBOL_PATH environment variable. *
* using the -y <symbol_path> argument when starting the debugger. *
* using .sympath and .sympath+ *
*********************************************************************
*********************************************************************
* Symbols can not be loaded because symbol path is not initialized. *
* *
* The Symbol Path can be set by: *
* using the _NT_SYMBOL_PATH environment variable. *
* using the -y <symbol_path> argument when starting the debugger. *
* using .sympath and .sympath+ *
*********************************************************************
ADDITIONAL_DEBUG_TEXT:
Use '!findthebuild' command to search for the target build information.
If the build information is available, run '!findthebuild -s ; .reload' to set symbol path and load symbols.
MODULE_NAME: win32k
FAULTING_MODULE: 804d7000 nt
DEBUG_FLR_IMAGE_TIMESTAMP: 51ad4593
EXCEPTION_CODE: (NTSTATUS) 0xc0000005 - Instrukcja spod "0x%08lx" odwo
FAULTING_IP:
win32k+62276
bf862276 f6412180 test byte ptr [ecx+21h],80h
TRAP_FRAME: a86f8ae4 -- (.trap 0xffffffffa86f8ae4)
ErrCode = 00000000
eax=e3eb4780 ebx=00000000 ecx=00040038 edx=00000000 esi=a86f8b80 edi=e3e70008
eip=bf862276 esp=a86f8b58 ebp=a86f8b68 iopl=0 nv up ei pl nz na pe cy
cs=0008 ss=0010 ds=0023 es=0023 fs=0030 gs=0000 efl=00010207
win32k+0x62276:
bf862276 f6412180 test byte ptr [ecx+21h],80h ds:0023:00040059=??
Resetting default scope
ok nie ma sprawy, wiadomo to nie jest do końca pewność ale pierwsze to trzeba niestety zacząć od pasty i chłodzenia, wtedy będzie wiadomo co dalej robić, RAM na ogół bardzo rzadko się wykruszają, a najczęstszym objawem screen-ów jest właśnie chłodzenie, potem RAM no i system lub dysk, nie zapomnij też o chłodzeniu na karcie graficznej
Karta jest stara i chłodzona samym radiatorem. I tak już pomału realizuję wymianę "wnętrzności". Wymieniona płyta główna i nowy zasilacz. Kupiony nowy RAM (DDR3), ale muszę mieć procka na socket AM3, bo inaczej RAMu nie obsługuje. Czyli kiedyś tam wymienie procka w pierwszej kolejności. Potem kartę graficzną i na końcu dysk, no chyba, że coś się zawieruszy wcześniej. Ale najpierw pasta termoprzewodząca na starego procka.
✨ Użytkownik zgłasza problemy z niebieskimi ekranami (BSOD) oraz błędami w programach i grach, podejrzewając uszkodzenie pamięci RAM. W odpowiedzi na prośbę o pomoc, uczestnicy dyskusji sugerują przeprowadzenie testów pamięci za pomocą Memtest oraz OCCT, a także sprawdzenie temperatury procesora. Użytkownik wykonuje testy, które wskazują na wysoką temperaturę CPU, co może być przyczyną problemów. Wskazówki obejmują również wymianę pasty termoprzewodzącej oraz konserwację chłodzenia. Użytkownik planuje wymianę komponentów, w tym RAM-u i płyty głównej, oraz korzysta z nowego oprogramowania antywirusowego. Podsumowanie AI na podstawie dyskusji. Może zawierać błędy.








 Nie mogę nic robić. Gram w Obliviona po jakimś czasie gra sie zamyka i wyskakuję raport o błedzie. Gram w League of Legends po kilkunastu minutach gra sie wylacza i report o bledzie. Oglądam filmiki na YT w google chrome, przegladarka sie zawiesza. Odpalam tryb ekonomiczny w tuneup - report o bledzie.